Career Data Charts
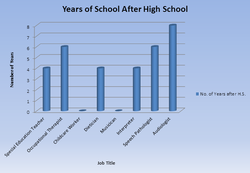
In this activity we were required to create three separate graphs from parts of our career data that we collected earlier in the year. In order to complete this assignment we used all of the excel tools we have learned earlier in the year. We used the tools necessary to create graphs. Also, we used various formatting tools in order to format each chart differently. By completing this activity I learned one new skill. I learned how to change the colors of different tabs in an Excel spreadsheet. One thing I did well in this assignment was I used the formatting tools to format each graph differently but still make them appealing to look at. If I was to do this assignment again I would not change anything because I feel this assignment came out good.
Career Glog
This was the culminating project of our career research. I chose my top career as Speech- Language Pathology. In this project we were required to make a glog (online poster) explaining why people would want to go into our chosen career path. In order to complete this activity we used brand new skills and tools that we learned in Glogster. Also, we were required to find a video that explains our career choice and properly embed it into our glog. We used different pictures in order to make our glog visually appealing. We also learned how to link pictures and text to different websites. This way to either site where a picture came from or to allow people to get more information about a ceratin topic. By completing this assignment I learned mulstiple new skills. I learned how to link pictures and videos to their respective sites. I also, learned how to navigate through Glogster as a whole. One thing I did well in this assignment was the balance of text and pictures on my glog. Something that I would have done differently if I was to do this again is to use brighter colors to make my glog more exciting.
